워드 클라우드를 만드는 순서는 아래와 같다.
1.
워드 클라우드를 만들 원본 데이터들이 있는 텍스트 파일을 만든다.
a.
웹크롤링 가능
2.
텍스트 전처리
•
파일을 읽고, split()메서드를 사용해 단어 단위로 쪼갠다.
•
단어별 빈도수를 계산해 딕셔너리 형태로 저장한다.
•
분석에 의미가 없는 단어들(또는 조사들)은 제거한다.
3.
워드 클라우드 그리기
a.
wordcloud 라이브러리를 설치하고 불러온다.
b.
워드 클라우드를 그린다.
이미 txt 파일이 있다고 가정하고
텍스트 전처리부터 시작한다.
텍스트 전처리
파일 읽고 잘 읽었는지 확인
file = open('Dream.txt', 'r', encoding='UTF-8') # 인코딩 오류가 발생할 경우, 'cp949' 로 변경
text = file.read()
file.close()
# 100글자까지 잘 불러들였는지 확인
text[:100]
Python
복사
'I am happy to join with you today in what will go down in history as the greatest demonstration for '
split() 메서드로 단어 단위로 자르기
wordList = text.split()
# 앞에서부터 10개의 단어만 확인
wordList[:10]
Python
복사
['I', 'am', 'happy', 'to', 'join', 'with', 'you', 'today', 'in', 'what']
단어별 빈도수를 계산해 딕셔너리로 저장
# 가장 먼저 리스트에서 고유한 단어들만 저장
worduniq = set(wordList)
# 딕셔너리 선언
wordCount = {}
# 단어별 개수 저장
for w in worduniq:
wordCount[w] = wordList.count(w)
# 제외해도 될 조사, 단어들 수동으로 지정해주기
del_word = ['the','a','is','are', 'not','of','on','that','this','and','be','to', 'from']
# 제외하기
for word in del_word:
if word in wordCount:
del wordCount[word]
wordCount
Python
복사
# 대략 아래와 같은 결과가 출력된다.
{'It': 4,
'Constitution': 1,
'cannot': 5,
'her': 1,
'despair.': 1,
'winds': 1,
'speed': 1,
'Mississippi,': 2,
'dark': 1,
...}
Plain Text
복사
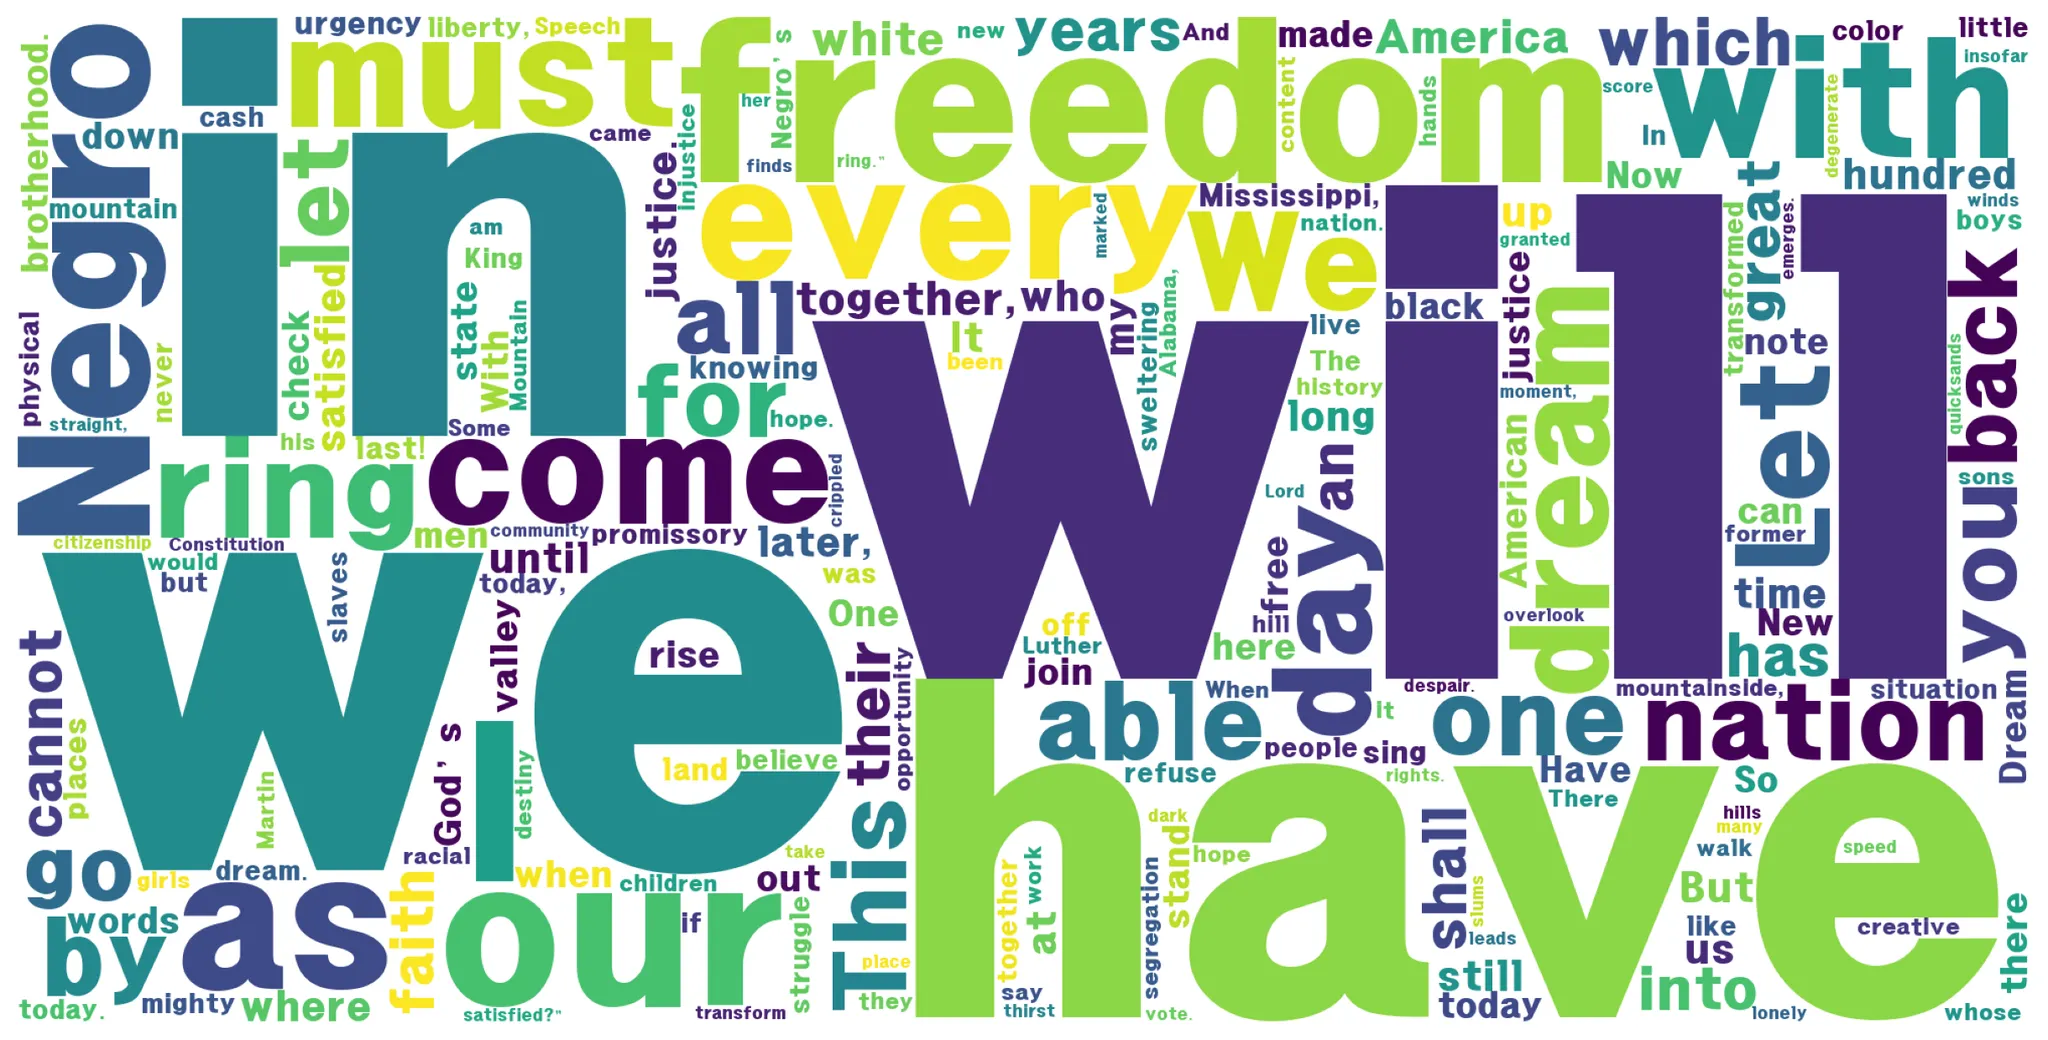
워드 클라우드 그리기
# 워드 클라우드 패키지 설치
!pip install wordcloud
# 시각화에 필요한 라이브러리 불러오기
import matplotlib.pyplot as plt
from wordcloud import WordCloud
%config InlineBackend.figure_format='retina' # 차트 고해상도
# 마스킹 이미지 활용하기
# masking_image = np.array(Image.open('HUMAN.jpg'))
# 워드 클라우드 만들기
wordcloud = WordCloud(font_path = 'C:/Windows/fonts/HMKMRHD.TTF', # 폰트 설정
width=2000,
height=1000,
# mask=masking_image,
background_color='white').generate_from_frequencies(wordCount)
# 표시하기
plt.figure(figsize=(12, 6))
plt.imshow(wordcloud)
plt.axis("off")
plt.tight_layout(pad=0)
plt.show()
Python
복사

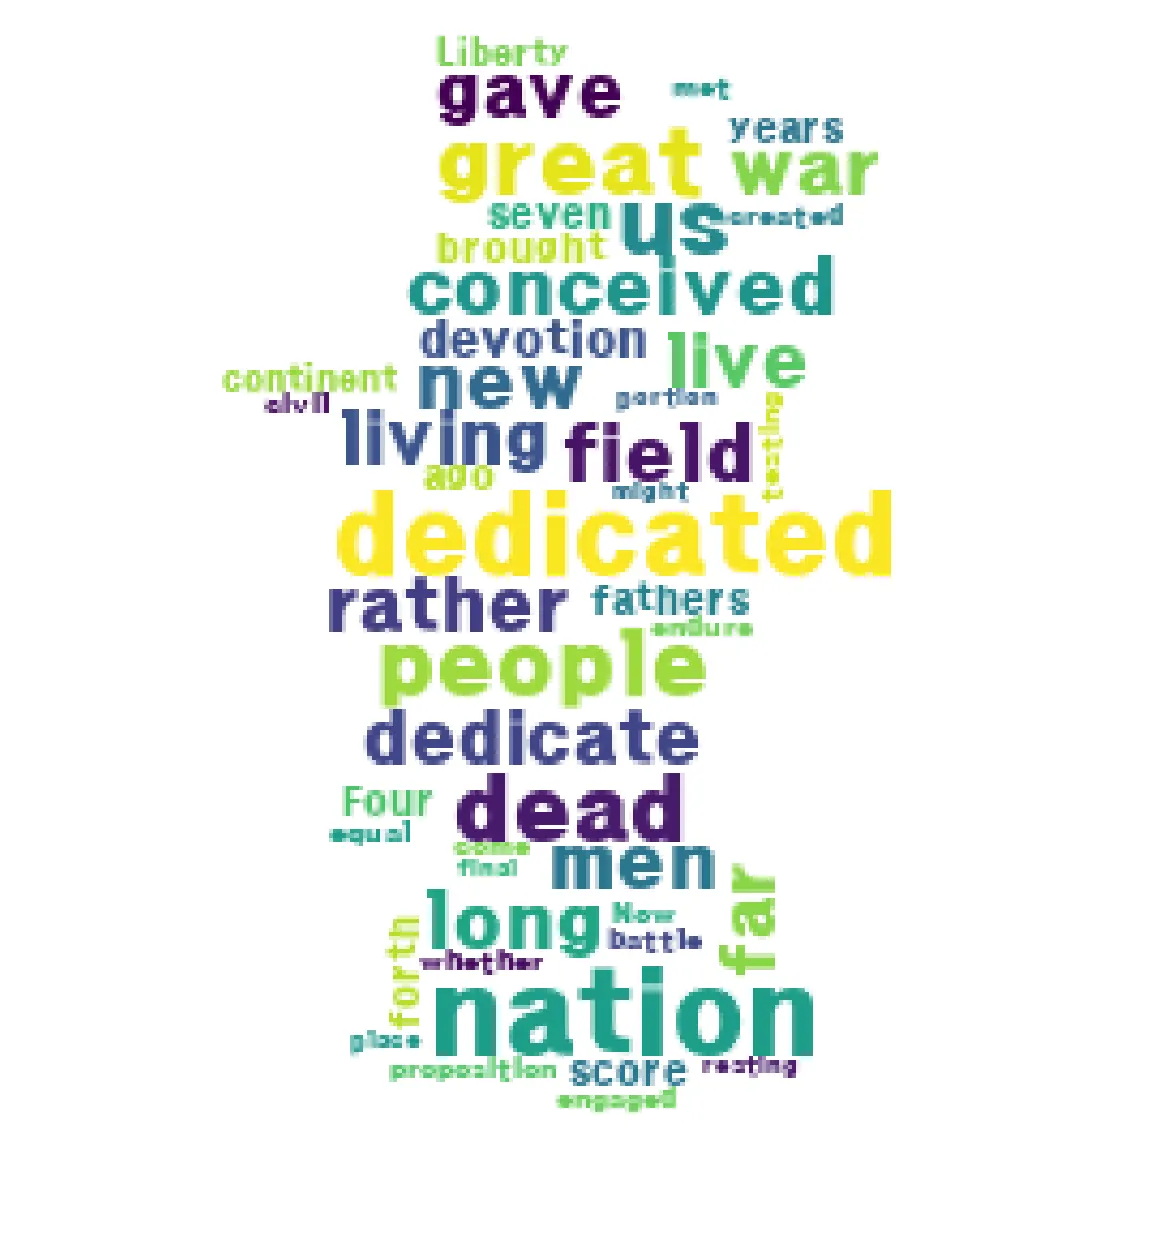
워드 클라우드 심화
# 링컨 연설문 워드 클라우드
from wordcloud import STOPWORDS
f = open('Lincoln.txt', 'r', encoding='UTF-8')
text = f.read()
f.close()
# 단어 자르기
wordList = text.split()
worduniqe = set(wordList)
wordCount = {}
for w in wordunique:
wordCount[w] = wordList.count(w)
# 불필요한데, 자주 나오는 단어들을 수동으로 더해주기
stopwords = set(STOPWORDS)
stopwords.add('the')
stopwords.add('a')
stopwords.add('and')
stopwords.add('have')
stopwords.add('that')
stopwords.add('to')
stopwords.add('for')
# 워드 클라우드
import matplotlib.pyplot as plt
from wordcloud import WordCloud
import numpy as np
from PIL import Image
# 차트 고해상도 설정
%config InlineBackend.figure_format='retina'
# 이미지 불러오기
masking_image = np.array(Image.open('Lincoln.jpg'))
# 워드 클라우드 만들기
wordcloud = WordCloud(font_path = 'C:/Windows/fonts/HMKMRHD.TTF',
stopwords=stopwords,
width=2000,
height=1000,
mask=masking_image,
background_color='white').generate_from_frequencies(wordCount)
wordcloud = wordcloud.generate(text)
# 표시하기
plt.figure(figsize=(12, 6))
plt.imshow(wordcloud)
plt.axis("off")
plt.tight_layout(pad=0)
plt.show()
Python
복사