크롤링을 진행할 때, 동적 페이지의 경우에는 앞선 방식의 크롤링으로 접근할 수가 없다. 세번째 프로젝트에서는 이 동적 페이지를 크롤링해오는 방법에 대해 다룬다.
목차
프로젝트의 주제는 다음과 같다.
 셀프 주유소가 싸다고 알려져있는데, 정말로 그럴까?
동적 페이지
셀레니움 설치
•
콘다 환경에서 다운로드 할거면 콘다 활성화
•
맥북 m1 유저라면,
!pip3 install selenium
Python
복사
chrome driver 다운로드
크롬 도움말 → 크롬 정보 → 크롬 버전 확인 후
사이트 들어가서, 앞번호 버전과 일치하는 드라이버 다운로드
→ 파일을 ds_study의 driver 파일로 옮기기 (cmd + c 후 cmd + opt + v)
또는 터미널에서 파일을 옮기는 방법은
mv ~Downloads/chromedriver/ ~/Documents/ds_study/driver\
Shell
복사
chrome driver 불러오기
from selenium import webdriver
# 크롬 브라우저로 webdriver 읽기
driver = webdriver.Chrome()
driver.get('https://www.naver.com')
# driver 꺼주기
driver.quit()
Python
복사
데이터를 확보하기 위한 작업 - selenium 으로 동적페이지의 엑셀 데이터 다운로드 받기
위의 국내 존재하는 모든 주유소의 정보를 얻어올 수 있다.
•
목표 데이터
◦
주유소 브랜드
◦
휘발유 가격
◦
셀프 주유 여부
◦
위치
# 페이지 접근하는 함수 만들어주기
def main_get():
url = 'https://www.opinet.co.kr/searRgSelect.do'
driver = webdriver.Chrome()
driver.get(url)
main_get()
Python
복사
selenium 으로 시/도 데이터 추출하기
from selenium.webdriver.common.by import By
# 시/도 부분 데이터 가져오기
# 태그가 ID 일 경우
sido_list_raw = driver.find_element(By.ID, 'SIDO_NMO')
# 다시 위의 태그에서 세부적으로 들어가기
# 태그 이름이 "option" 인 부분 가져오기 - 여러개라서 find_elements 로 가져오기
sido_list = sido_list_raw.find_elements(By.TAG_NAME, 'option')
# 속성 value 안에 있는 지역의 풀네임에 접근하기 - '서울특별시'
sido_list[1].get_attribute('value')
# 모든 시/도의 풀네임 데이터를 리스트에 받기
sido_names = [option.get_attribute('value') for option in sido_list]
# 시/도 데이터 중 서울특별시의 지역 데이터를 원하기 때문에
# selenium 의 send_keys() 함수를 사용해서 '서울특별시'로 웹드라이버에서 선택하게 해주기
sido_list_raw.send_keys(sido_names[0])
Python
복사
selenium으로 ‘구’ 데이터 추출하기
gu_list_raw = driver.find_element(By.ID, 'SIGUNGU_NM0')
# 태그 이름이 'option'인 부분 가져오기
gu_list = gu_list_raw.find_elements(By.TAG_NAME, 'option')
gu_names = [option.get_attribute('value') for option in gu_list]
Python
복사
위의 과정을 한꺼번에 수행해서, ‘엑셀로 다운로드’ 까지 수행해보기
import time
from tqdm import tqdm_notebook
def data_download():
# '서울특별시' 데이터를 선택해주기
sido_list_raw = driver.find_element(By.ID, 'SIDO_NMO')
sido_list = sido_list_raw.find_elements(By.TAG_NAME, 'option')
sido_list[1].get_attribute('value')
sido_names = [option.get_attribute('value') for option in sido_list]
sido_names = sido_names[1:]
sido_list_raw.send_keys(sido_names[0])
# 구 데이터 다운로드 받기
gu_list_raw = driver.find_element(By.ID, 'SIGUNGU_NM0')
gu_list = gu_list_raw.find_elements(By.TAG_NAME, 'option')
gu_names = [option.get_attribute('value') for option in gu_list]
gu_names = gu_names[1:]
for gu in tqdm_notebook(gu_names):
gu_list_raw.send_keys(gu)
time.sleep(3)
# 엑셀 저장 클릭 - xpath 로 읽어오기
driver.find_element(By.XPATH,'//*[@id="glopopd_excel"]').click()
time.sleep(3)
data_download()
Python
복사
# 꼭 마지막에는 driver 꺼주기
driver.close() # 또는 driver.quit()
Python
복사
다운로드 받은 데이터 전처리 작업 하기
•
glob
•
concat
•
결측치 데이터 제거
•
데이터 타입 변환
•
인덱스 재설정
glob
파일들의 리스트를 뽑을 때 사용하는데, 파일의 경로명을 이용해서 입맛대로 사용할 수 있다.
인자로 받은 패턴과 이름이 일치하는 모든 파일과 디렉터리의 리스트를 반환한다.
사용 예제
import pandas as pd
import numpy as np
from glob import glob
# 다운로드 받은 서울특별시의 '구'별 파일 목록을 리스트로 가져오기
station_files = glob('../data/지역_*.xls')
# 맨 첫번째 파일을 읽어보기
tmp = pd.read_excel(station_files[0], header=2)
tmp.tail()
# 각각의 파일에 대해 읽어들인 데이터를 리스트 원소에 저장
tmp_raw = []
for file_name in station_files:
tmp = pd.read_excel(file_name, header=2)
tmp_raw.append(tmp)
Python
복사
concat
파일들의 구조가 동일하기 때문에 concat을 이용해서 합쳐주기
station_raw = pd.concat(tmp_raw)
Python
복사
필드명 변경해주기
stations = pd.DataFrame({
"상호": staton_raw['상호'],
"주소": staton_raw['주소'],
"셀프": staton_raw['셀프여부'],
"상표": staton_raw['상표'],
"휘발유": staton_raw['휘발유'],
})
stations.tail()
Python
복사
주소 데이터에서 ‘구’ 필드 만들어주기
stations['구'] = [eachAddress.split()[1] for eachAddress in stations['주소']]
Python
복사
가격 데이터 타입 변환 : object → float
stations['가격'] = stations['가격'].astype('float')
#### 오류 발생 ####
#### 이유 : could not convert string to float: '-'
# 가격 데이터에 있는 '-' 데이터는 모두 삭제해주자
stations = stations[stations['가격'] != '-']
# 다시 변환!
stations['가격'] = stations['가격'].astype('float')
Python
복사
인덱스 재정렬
stations.reset_index(inplace=True, drop=True)
Python
복사
주유 가격 정보 기본 시각화
import matplotlib.pyplot as plt
import seaborn as sns
import platform
from matplotlib import font_manager, rc
%matplotlib inline
if platform.system() == 'Darwin':
rc('font', family='Arial Unicode MS')
else:
print('Unknown System.')
Python
복사
1. boxplot
셀프 주유소인지 아닌지의 여부에 따라 가격의 분포가 다를까?•
pyplot
stations.boxplot(column='가격', by='셀프', figsize=(12,8))
Python
복사
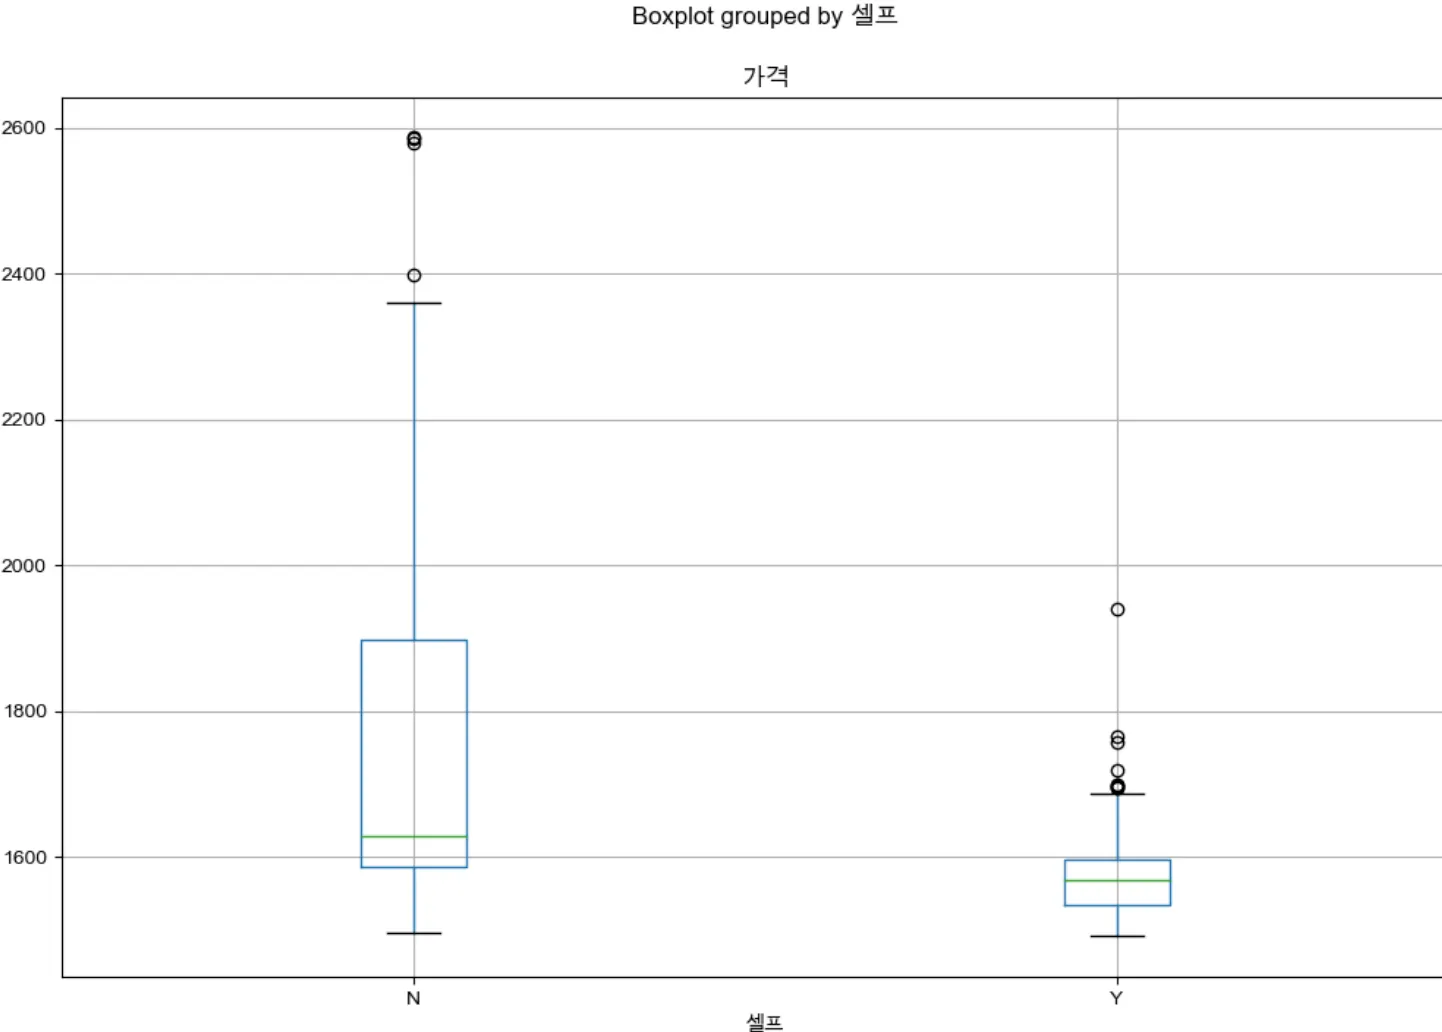
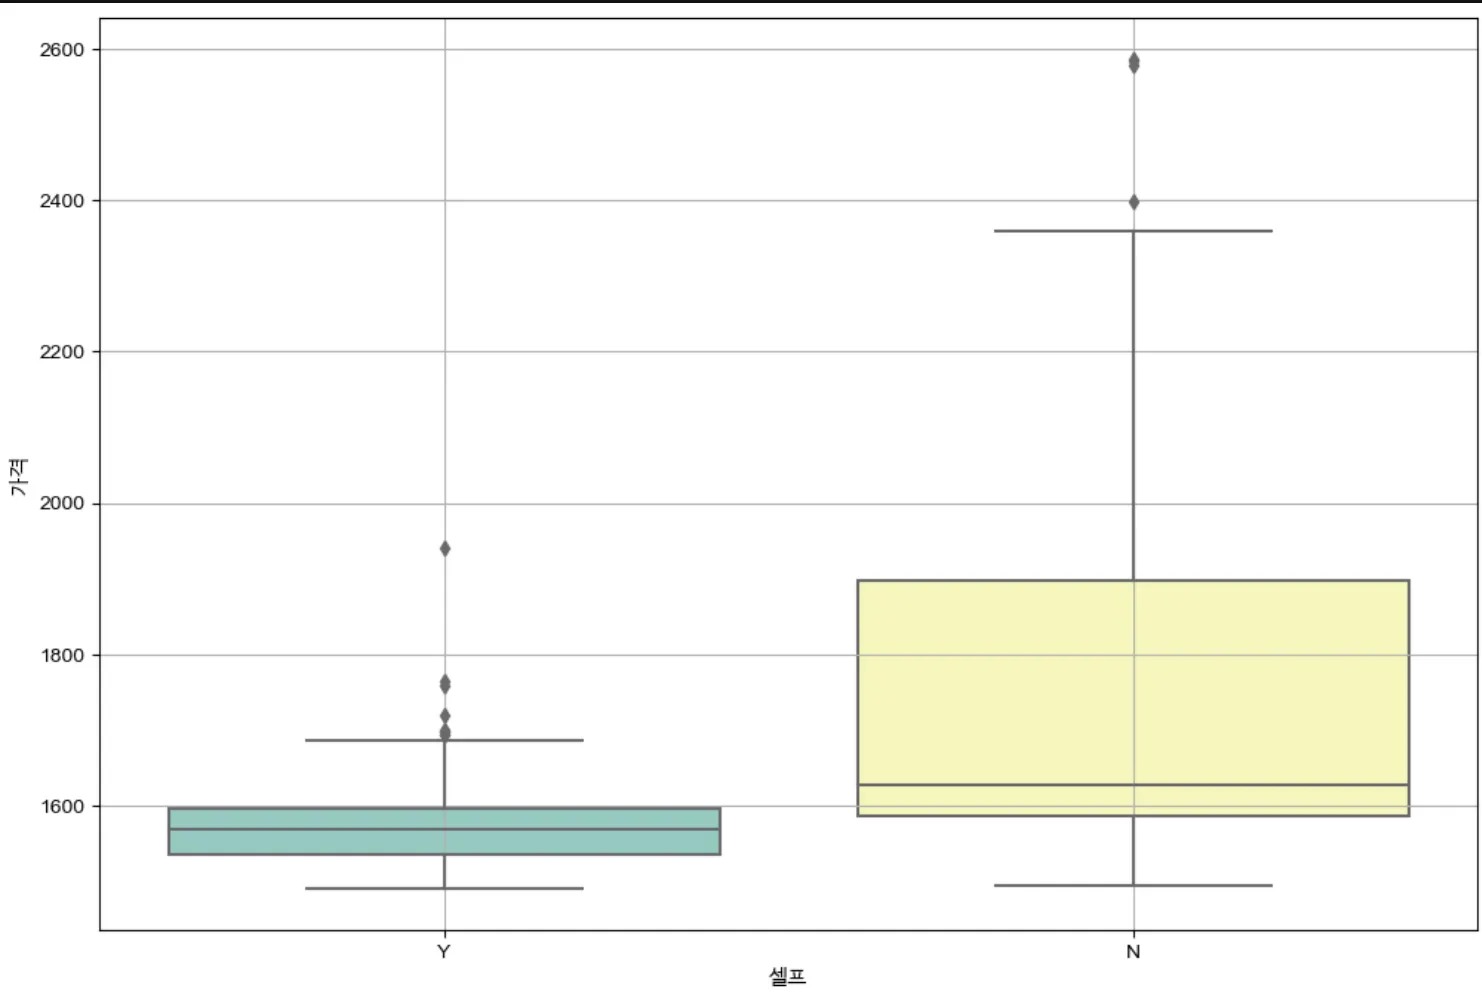
중앙값의 경우, 확실히 셀프주유소가 가격이 더 저렴한 것을 확인할 수 있다. 또한, 가격의 편차도 셀프 주유소의 경우가 더 작은 것을 확인할 수 있다.
•
seaborn
plt.figure(figsize=(12,8))
sns.boxplot(x='셀프', y='가격', data=stations, palette='Set3')
plt.grid(True)
plt.show()
Python
복사
 브랜드에 따라 가격의 편차는 어떻게 될까?
plt.figure(figsize=(12,8))
sns.boxplot(x='상표', y='가격', hue='셀프', data=stations, palette='Set3')
plt.grid(True)
plt.show()
Python
복사
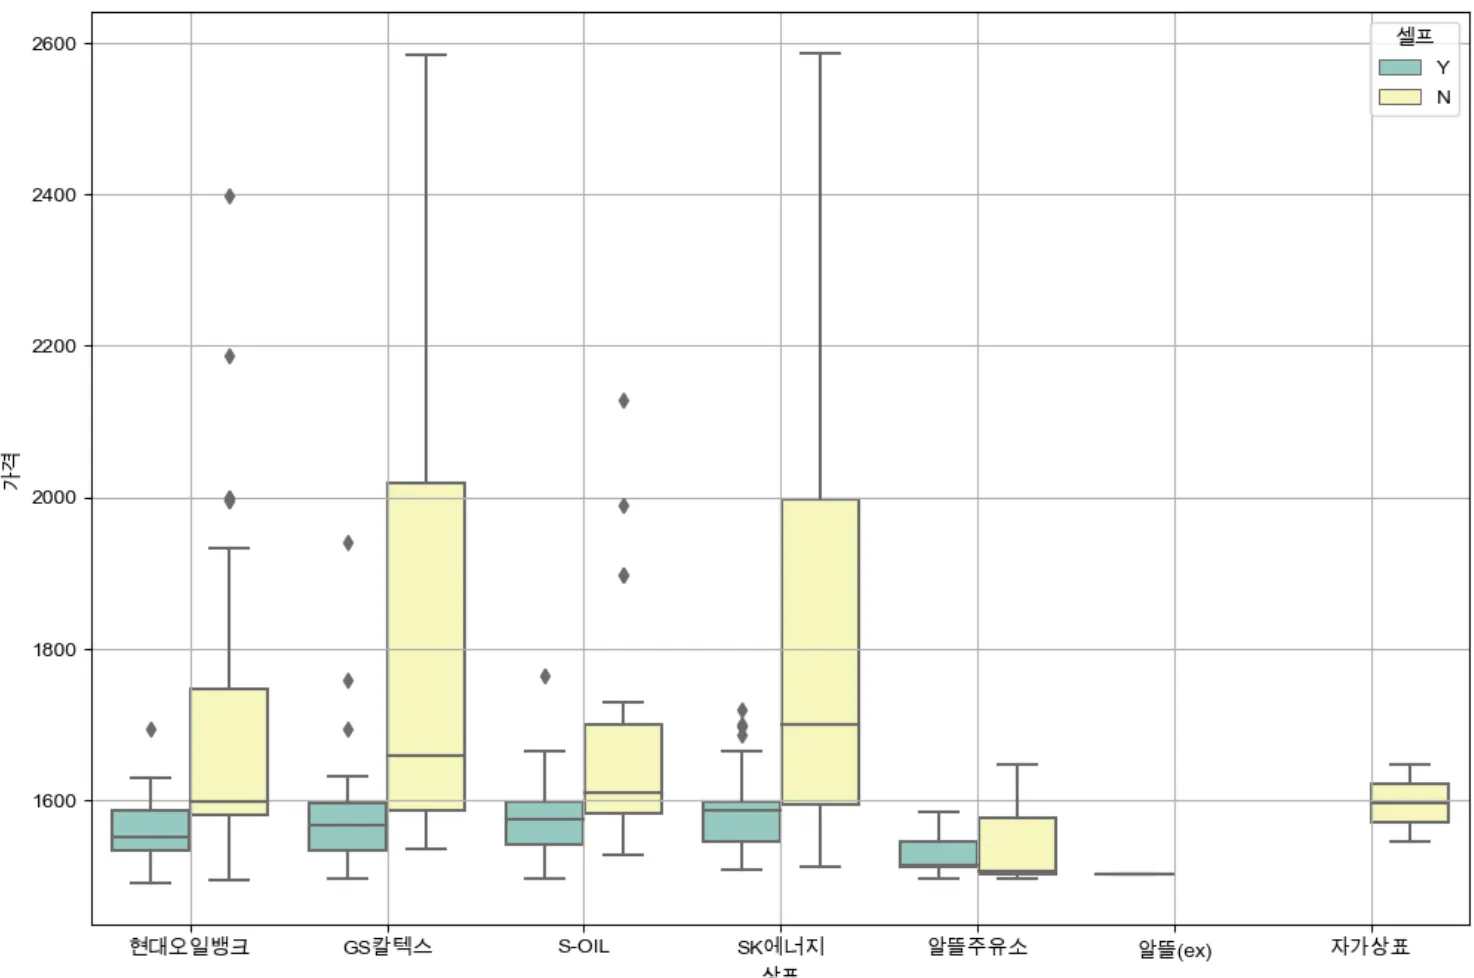 가장 눈에 띄는 점은 gs칼텍스, sk에너지의 경우, 셀프 주유소가 아닌 경우의 가격 편차가 다른 주유 브랜드에 비해 큰 것을 확인할 수 있다.
셀프 주유가 가능한 브랜드 중, 알뜰주유소가 가장 낮은 가격으로 제공하는 것을 확인했다.
셀프 주유가 아닌 경우, sk에너지의 주유가격 중앙값이 가장 높은 것으로 확인됐다.
가장 눈에 띄는 점은 gs칼텍스, sk에너지의 경우, 셀프 주유소가 아닌 경우의 가격 편차가 다른 주유 브랜드에 비해 큰 것을 확인할 수 있다.
셀프 주유가 가능한 브랜드 중, 알뜰주유소가 가장 낮은 가격으로 제공하는 것을 확인했다.
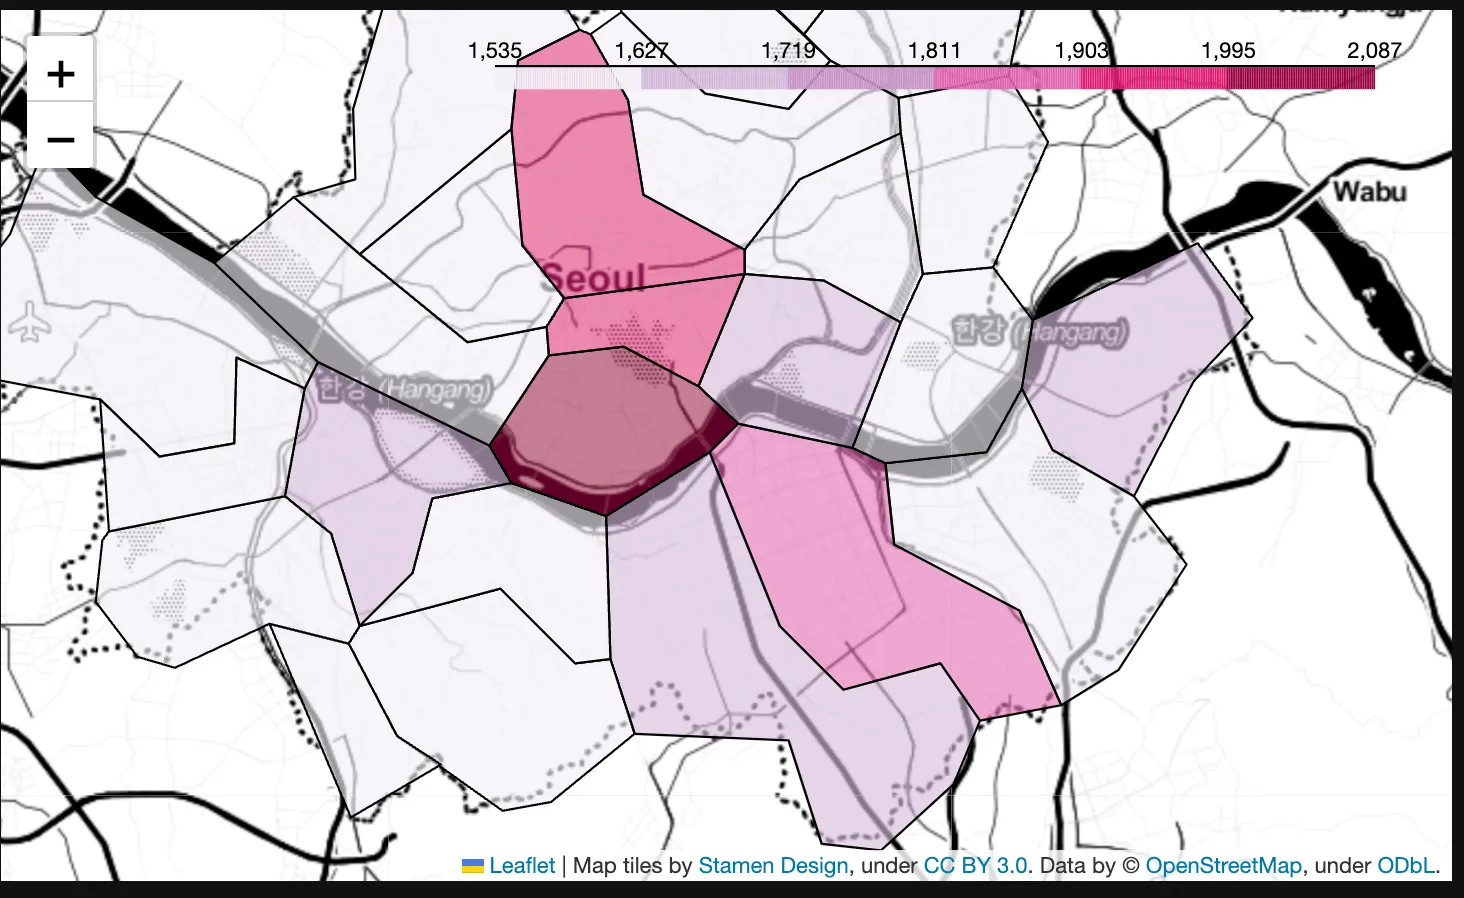
셀프 주유가 아닌 경우, sk에너지의 주유가격 중앙값이 가장 높은 것으로 확인됐다. 2. folium - 지도 시각화
import json # 지도 경계선 데이터가 json 데이터이기 때문에
import folium
import warnings
warnings.filterwarnings('ignore')
gu_data = pd.pivot_table(data=stations, index='구', values='가격', aggfunc=np.mean)
geo_path = '../data/02. skorea_municipalities_geo_simple.json"
geo_str = json.load(open(geo_path, encoding='utf-8'))
my_map = folium.Map(location=[37.5502, 126.982], zoom_start=10.5, tiles='Stamen Toner')
my_map.choropleth(
geo_data=geo_str,
data=gu_data,
columns=[gu_data.index, '가격'],
key_on='feature.id',
fill_color='PuRd'
)
my_map
Python
복사